Craig’s Closing Grain Market Comments
January 12, 2015
In this price environment having an understanding of the market and how to create a marketing plan to respond to it may be very important. I will be putting on marketing meetings this winter in an attempt to help you with these decisions. The schedule for this week is as follows:
January 13th – Pollock School at 3 p.m.
January 14th – Warner Community Building at 1 p.m.
January 15th – Herreid Community Center at 11 a.m.
January 15th – Hague at the Amvets at 2 p.m.
Corn:
The bulls had been hoping that today would show a reduction in corn acres and while we saw a reduction of 300,000 planted acres the harvested acres were left unchanged and that was disappointing. What was unexpected and friendly was the reduction in the national average yield. The average trade guess was for a number of 173.3 bu/acre so today’s USDA number of 171 bu/acre was actually below the low end of the range of guesses and has to be viewed as friendly. This reduction had the net effect of reducing the 2014-15 projected carry-out to 1.877 billion bushels. The December number was 1.998 and the average trade guess was 1.927 so again this was friendly.
When viewed through the lens of the world situation we saw a slight reduction in projected worldwide carry-out as it slipped from a projected 192.9 MMT in the December report to 189.2 MMT in today’s version.
Technically, two of my three technical indicators are bullish as we continue to trade in a sideways pattern. As I look at the March futures it appears to me as if we have support at $3.84 with more significant support at $3.64. On the upper end the $4.17 area looks formidable and of course the gap looms at $4.26.

Soybean:
I would love to know just what in the world the professional traders were looking at today. We were all waiting for the USDA report to come out at 11 this morning and as the bell chimed the 11 o’clock hour the March soybean futures were trading at $10.47 ½ then the trade looked at the report and saw something because in the next 5 seconds the price spiked up to $10.61 ½. Although I had not yet seen the report I thought, well it must be positive. Then from 11:00:05 and 11:00:15 we traded from $10.61 ½ to $10.46. In other words, in the span of 15 seconds we had the market make a $0.14 up move followed by a $0.15 ½ down move. If I was guessing I would guess that the first thing that traders saw was a reduction in planted and harvested acres and had a bullish kneejerk reaction and then saw the increased production number, uttered a loud “Oh, crap” and started selling.
The fact is that harvested acres were reduced by 300,000 acres but the national average yield was bumped up by 0.3 bu/acre to 47.8 bushels per acre. The net result was an increase in total production of 11 million bushels. It is worth noting that this makes 5 of the past six years since 1993 in which we have seen record production that the January national average yield number has been larger than the December USDA estimate. The USDA offset this on the demand side by increasing export demand by 10 million bushels and bumping the residual use up by a million bushels. All of this gave us a projected carry-out that was unchanged at 410 million bushels. The average trade guess coming into the report was for a projected carry-out of 393 million bushels. The worldwide carry-out was a bit of a surprise as well with the trade looking for a world carry-out of 89.35 MMT, lower than the 90.78 MMT that the USDA presented us with in this report. With both the domestic and world carry-outs larger than expected one can now understand why the market plunged lower once the report was fully digested.
With this report now out of the way I would expect the attention to return to South American weather where we are quickly running out of time to generate a bullish weather market.
As a result of today’s close all three of my indicators are bearish. It should be further noted that we posted a key reversal lower on the charts today and I would think that at a minimum we will see the March futures test the $10 level with the November futures possibly finding some support at $9.75.

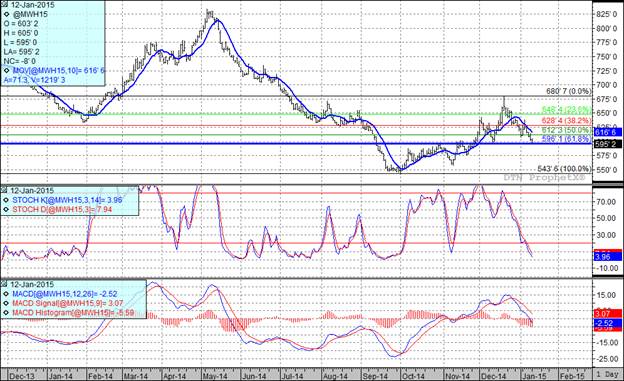
Wheat:
On the heels of last year’s harvest we saw the mills become very aggressive in testing for falling numbers with big discounts for low falling numbers. A number of people asked us about what caused low falling numbers and why they were being discounted for them. It may be a little late but the following video does a fantastic job of explaining why low falling numbers occur and what impact they have on the quality of the products being baked with that flour.
https://www.youtube.com/watch?v=YMjhdSskXP0
Today’s report brought minimal changes. We did see the USDA increase total supply by a million bushels while reducing feed usage by 30 million and seed by 2 million to register a net increase in the projected carry-out of 33 million bushels as that number now stands at a projected 687 million bushels.
The one area where I thought this market may get a bump was in the area of winter wheat planted acres. In December we were given a projected number of 42.399 million acres and the range of guesses coming into this report ran from 41 to 44 million acres with the average guess settling in at 42.632. With that background I have to believe that the trade was caught by surprise by today's winter wheat planted acres number of 40.45 million acres. While it didn’t give us bullish traction today perhaps it will come in to play in the coming days.
All three of my technical indicators are currently bearish both the Minneapolis and Kansas City March futures. I noted last week that this market is very oversold and in need of a short term bullish bounce. As you can see, today we moved right down to a full 61.8% Fibonacci retracement but didn’t break through it. I would not be surprised if we bounced higher in the short term but if we do it should be viewed as a selling opportunity.

Top Trending Reads:
- Grain Outlook for 2015
- How To Determine If Commodity Prices Are Too Low To Market Grain
- Using Futures Options In Grain Marketing
- Market Insider from the Farm and Ranch Guide
This data and these comments are provided for information purposes only and are not intended to be used for specific trading strategies. Commodity trading is risky and North Central Farmers Elevator and their affiliates assume no liability for the use of any information contained herein. Although all information is believed to be reliable, we cannot guarantee its accuracy and completeness. Past financial results are not necessarily indicative of future performance. Any examples given are strictly hypothetical and no representation is being made that any person will or is likely to achieve profits or losses similar to those examples.
North Central Farmers Elevator - 12 5th Ave. Ipswich, SD - 605-426-6021.